
Algoriz
Automate stock market analysis, track portfolios, and make informed decisions with advanced indicators and data visualization.
- Free plan available
- No credit card
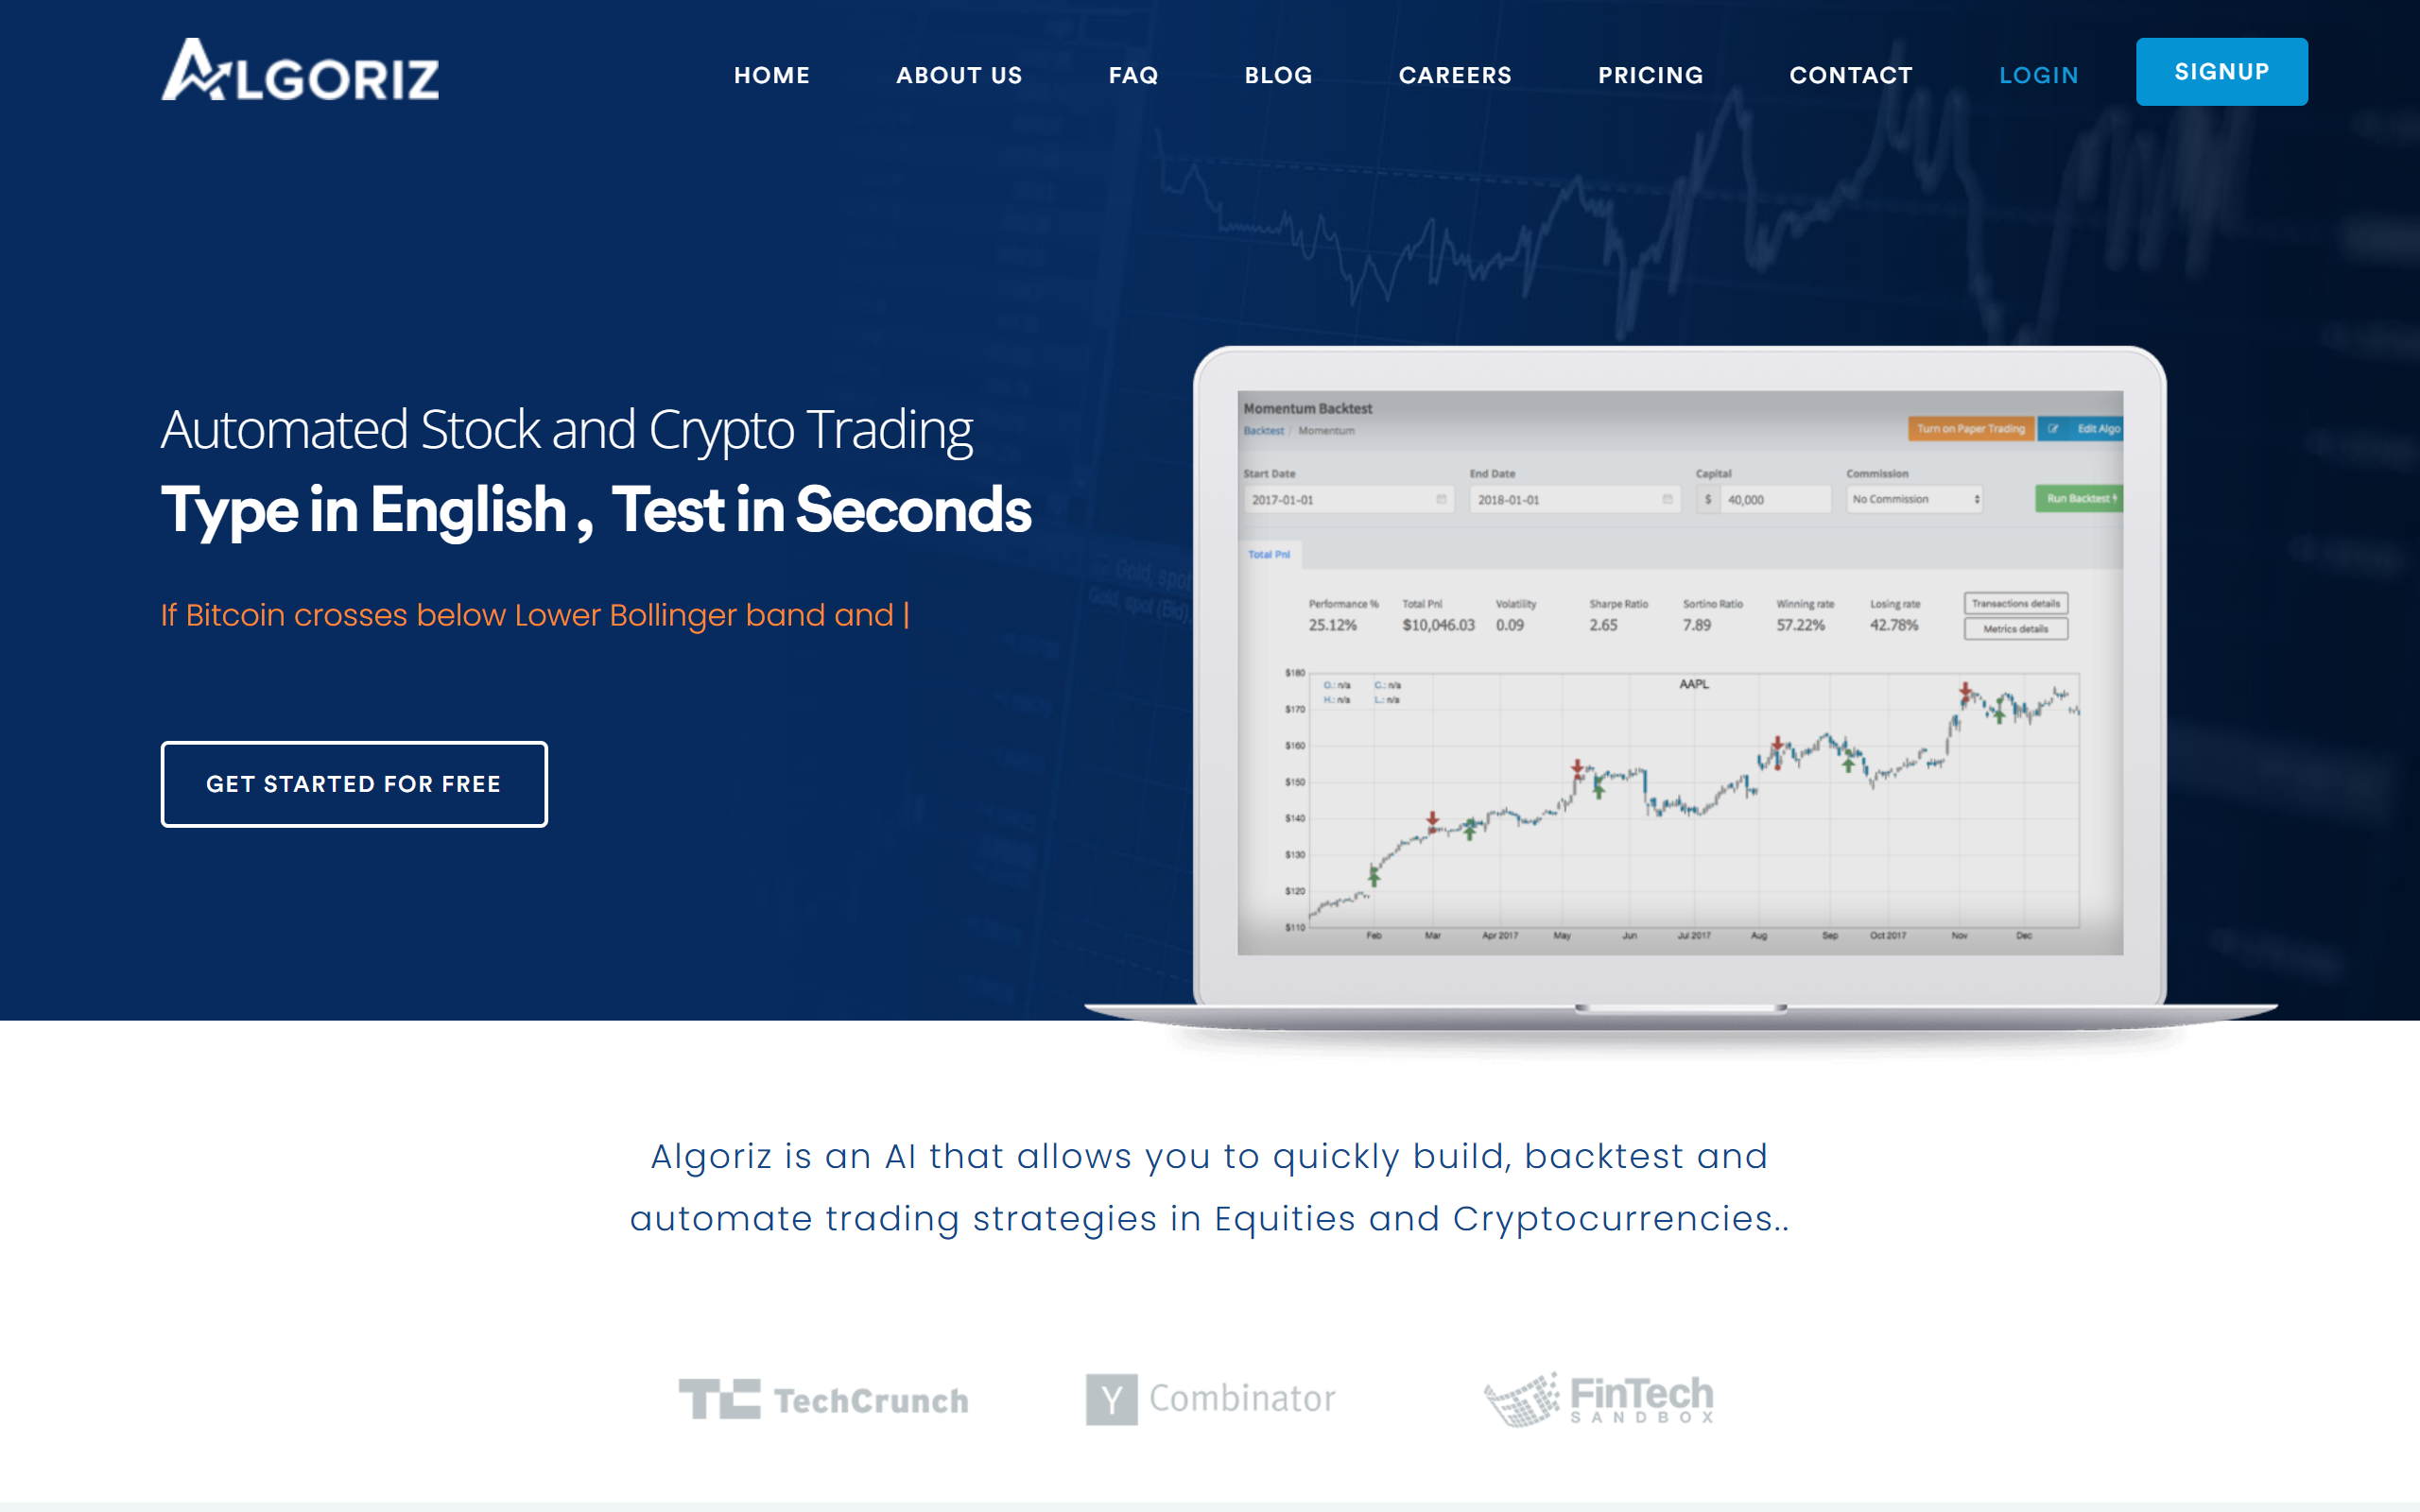
What is Algoriz?
Key features
Automated stock analysis
Processes market data and applies technical indicators without manual calculation
Portfolio tracking
Monitor multiple holdings in one place with real-time price updates and performance metrics
Data visualisation
Charts and graphs present market trends and indicator signals in easy-to-read formats
Advanced indicators
Access to technical analysis tools such as moving averages, relative strength index, and other standard metrics
Alert system
Receive notifications when tracked stocks meet specific price or indicator conditions
Pros & cons
Advantages
- Saves time by automating repetitive analysis tasks that would otherwise require manual work
- Freemium model lets you explore core features without upfront cost
- Consolidates portfolio tracking and analysis in one place rather than switching between tools
- Technical indicators help identify patterns and potential entry or exit points
Limitations
- Free tier likely has limitations on the number of stocks tracked, analysis frequency, or advanced features
- Technical indicators are tools for analysis, not guarantees of market performance or direction
- Effectiveness depends on your understanding of how indicators work and when to use them
Use cases
Monitoring a personal stock portfolio without manually checking prices across multiple websites
Screening for stocks that meet specific technical conditions, such as price above a moving average
Comparing performance of different holdings to identify which investments are underperforming
Setting up alerts for significant price moves or indicator signals on watched stocks
Learning technical analysis by experimenting with different indicators on real market data
Ready to try Algoriz?
Pricing
Free
Free
Basic portfolio tracking, standard technical indicators, limited number of watchlists
Premium
Contact for pricing
Unlimited portfolio tracking, advanced indicators, custom alerts, priority support
Get started with Algoriz
Click through to Algoriz and start using it now.
- Free plan available
- No credit card