Bricks
The AI Spreadsheet We've All Been Waiting For
- Free plan available
- No credit card
What is Bricks?
Key features
CSV and Excel import
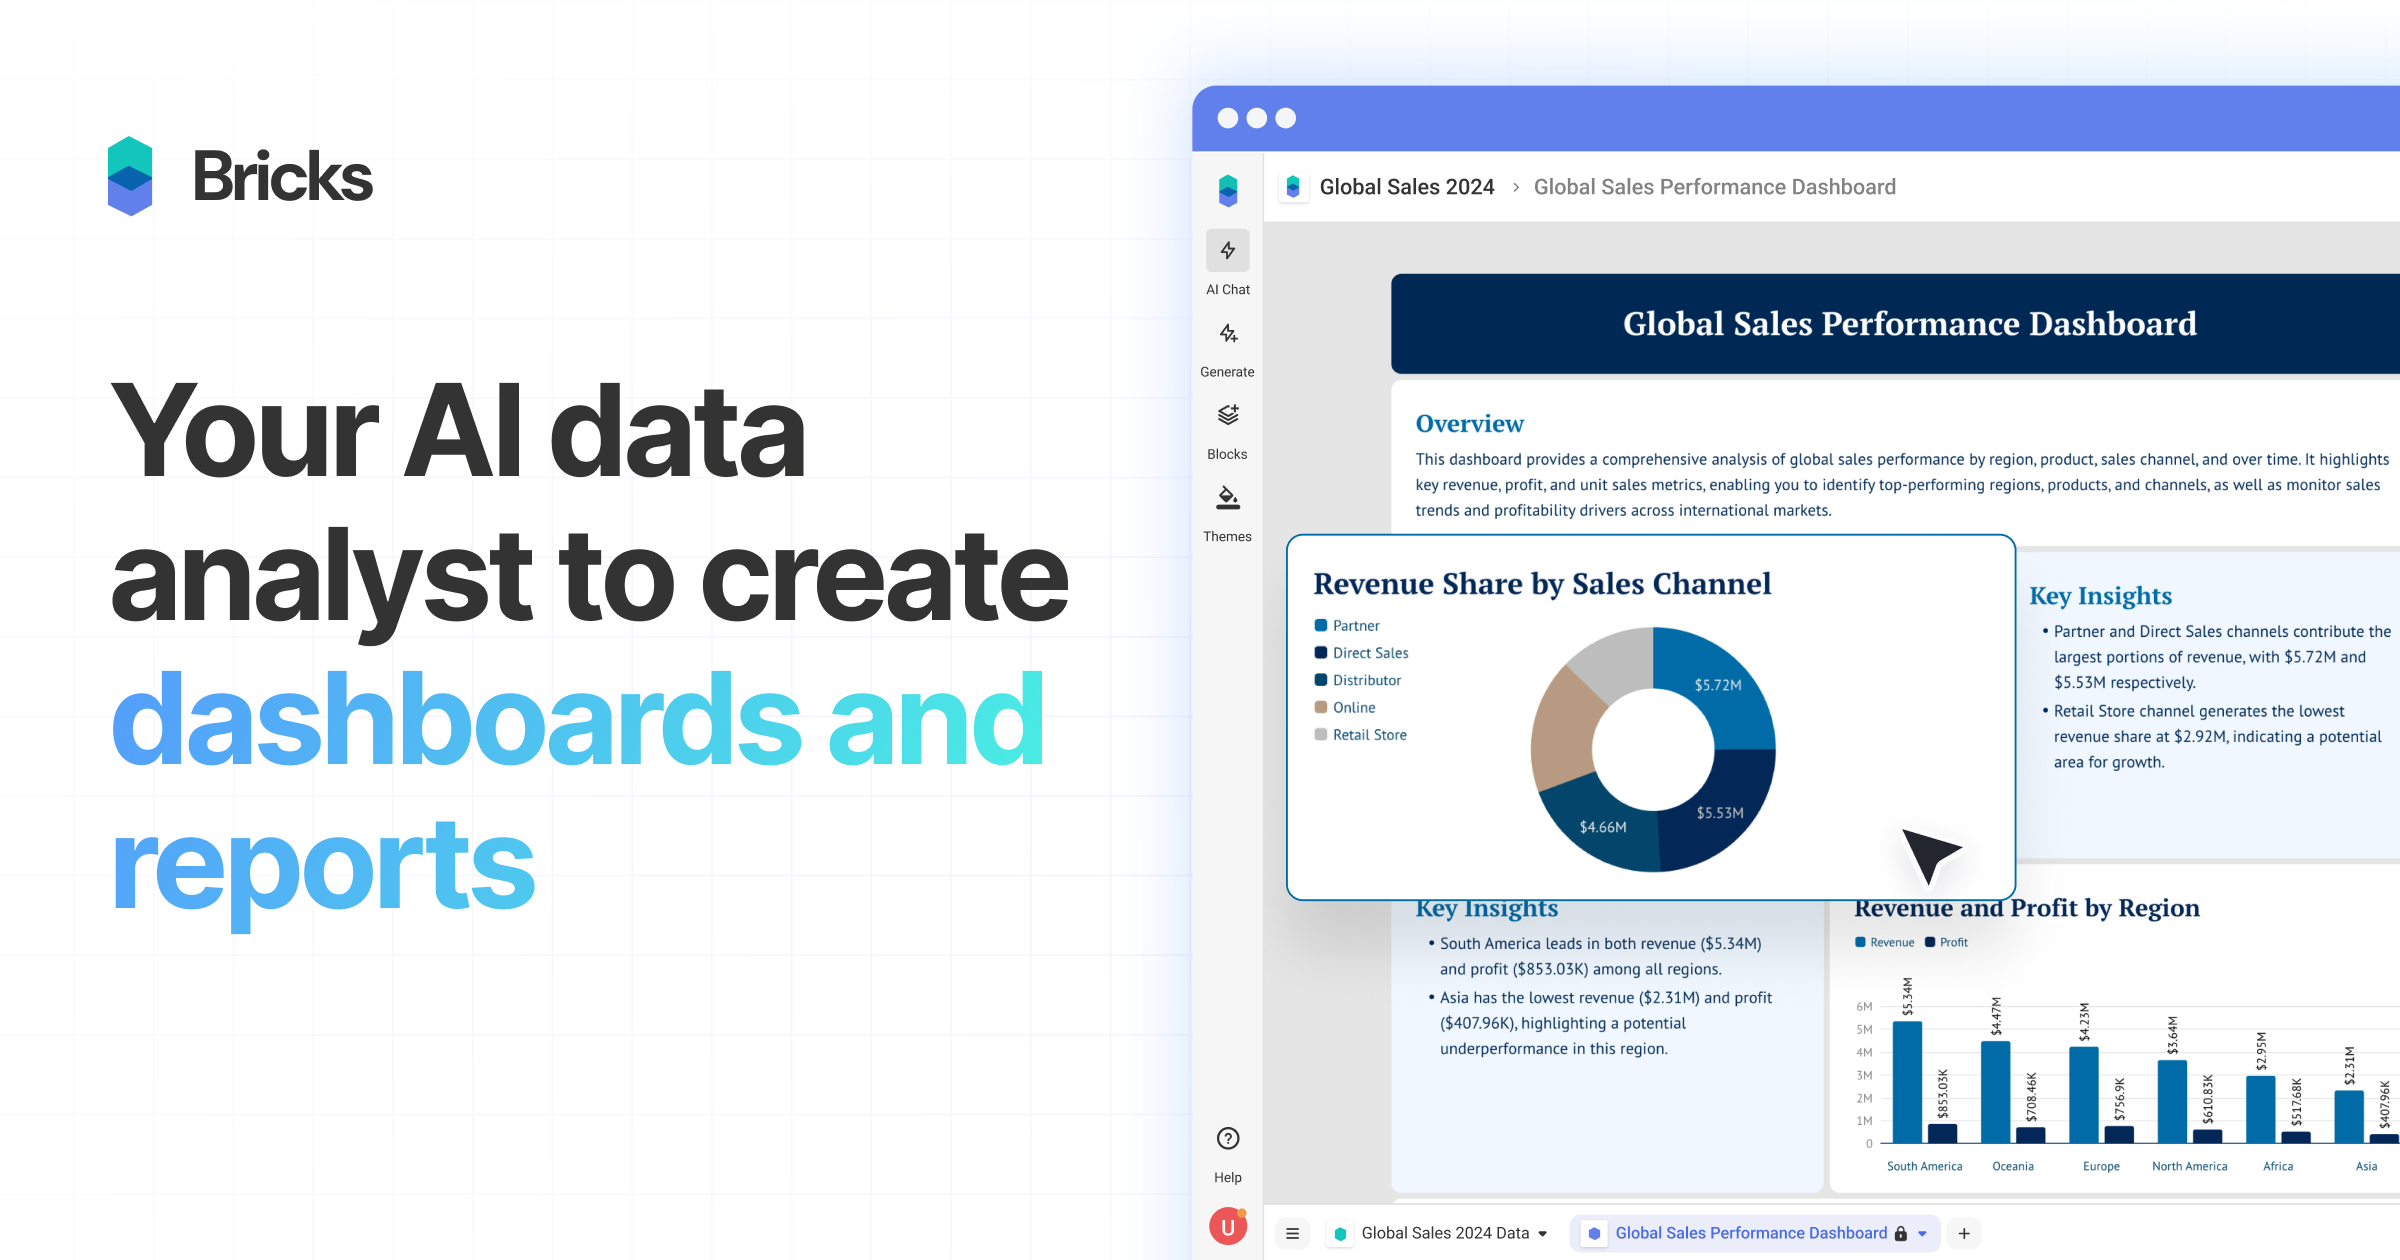
Upload your data files directly and start building dashboards immediately
Automatic dashboard generation
AI suggests visualisations and layouts based on your data
Interactive editing
Modify charts, filters, and layouts without writing code
Real-time collaboration
Work with team members on dashboards simultaneously
Customisable visualisations
Choose from various chart types and design options
Data refresh
Keep dashboards updated by reconnecting to your data sources
Pros & cons
Advantages
- No technical skills required; anyone can create dashboards quickly
- Fast setup with minimal configuration needed
- Free tier available for testing and smaller projects
- Clean interface that doesn't overwhelm non-technical users
Limitations
- Primarily designed for CSV and Excel files; integration with other data sources may be limited
- Advanced customisation options may be restricted compared to enterprise BI tools
- Performance with very large datasets has not been independently verified
Use cases
Small business owners analysing sales or customer data without hiring a data analyst
Marketing teams visualising campaign performance from spreadsheet data
Project managers tracking metrics and sharing progress reports with stakeholders
Consultants presenting data findings to clients in a professional format
Non-profit organisations monitoring programme data and impact metrics
Ready to try Bricks?
Pricing
Paid Plans
Pricing available on website
Unlimited dashboards, advanced collaboration, priority support, additional customisation options
Get started with Bricks
Click through to Bricks and start using it now.
- Free plan available
- No credit card