Bricks
The AI Spreadsheet We've All Been Waiting For
- Free plan available
- No credit card
What is Bricks?
Key features
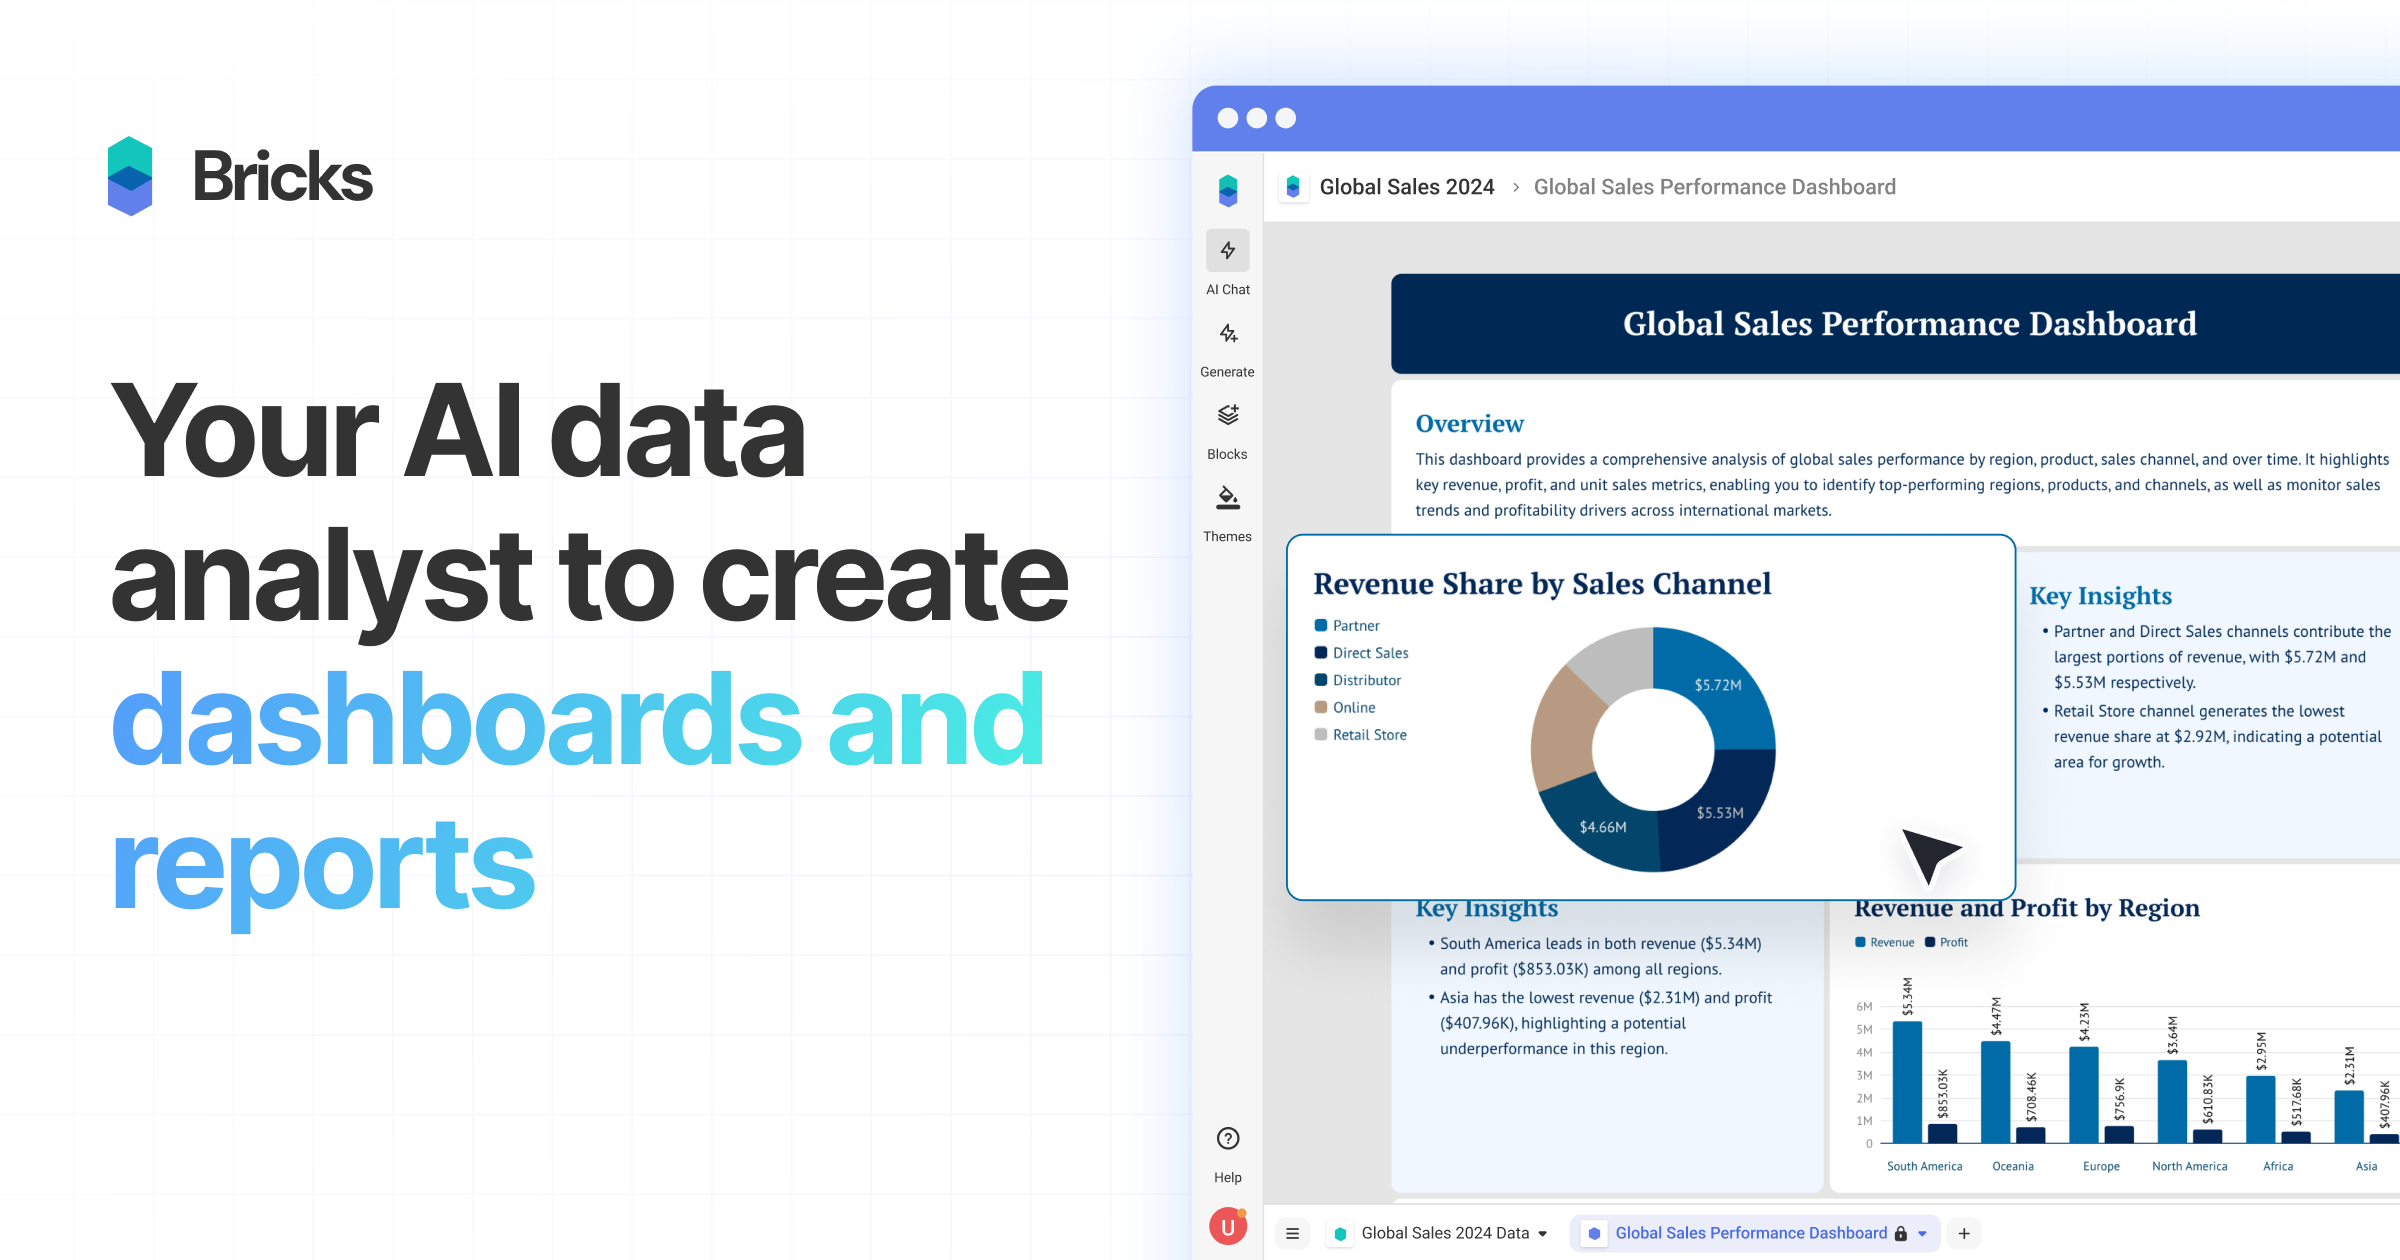
AI-powered dashboard generation
automatically converts uploaded data into visual representations without manual configuration
CSV and Excel file import
direct support for common spreadsheet file formats with no complex data mapping required
Editable dashboards
modify data and visualisations directly within the dashboard interface, not just view-only reports
No-code setup
builds dashboards without requiring SQL knowledge, coding experience, or technical configuration
Data visualisation
includes charts, tables, and other visual elements to represent data patterns and trends
Collaborative sharing
export and share dashboards with team members and stakeholders
Pros & cons
Advantages
- Significantly faster than building dashboards from scratch in traditional BI tools
- Low barrier to entry; non-technical users can create professional dashboards quickly
- Works directly with files you already have; no need to migrate data to new systems
- Freemium model means you can test it without upfront investment
Limitations
- May lack advanced customisation options compared to dedicated business intelligence platforms
- Limited information publicly available about data limits, refresh rates, or enterprise-scale capabilities
- Dependent on how well AI interprets your data structure; unusual or complex datasets may require manual adjustment
Use cases
Sales teams converting monthly performance spreadsheets into dashboards for quick status reviews
Finance departments creating expense tracking and budget variance reports from CSV exports
Marketing analysts visualising campaign metrics and ROI across multiple channels
Project managers building resource utilisation and timeline dashboards from project data
Small business owners monitoring KPIs without investing in expensive BI software
Ready to try Bricks?
Pricing
Free
Free
Basic dashboard creation, file imports, and sharing capabilities for individual users
Paid Plans
Contact for pricing
Likely includes advanced features such as team collaboration, increased storage, API access, and enhanced dashboard customisation (specific tiers and pricing not publicly listed)
Get started with Bricks
Click through to Bricks and start using it now.
- Free plan available
- No credit card