
Databox
Monitor progress, automate data analysis, create and share custom reports securely.
- Freemium
- Web, iOS, Android, API
- Data & AnalyticsAI Data Preparation Tools
- Free plan available
- No credit card
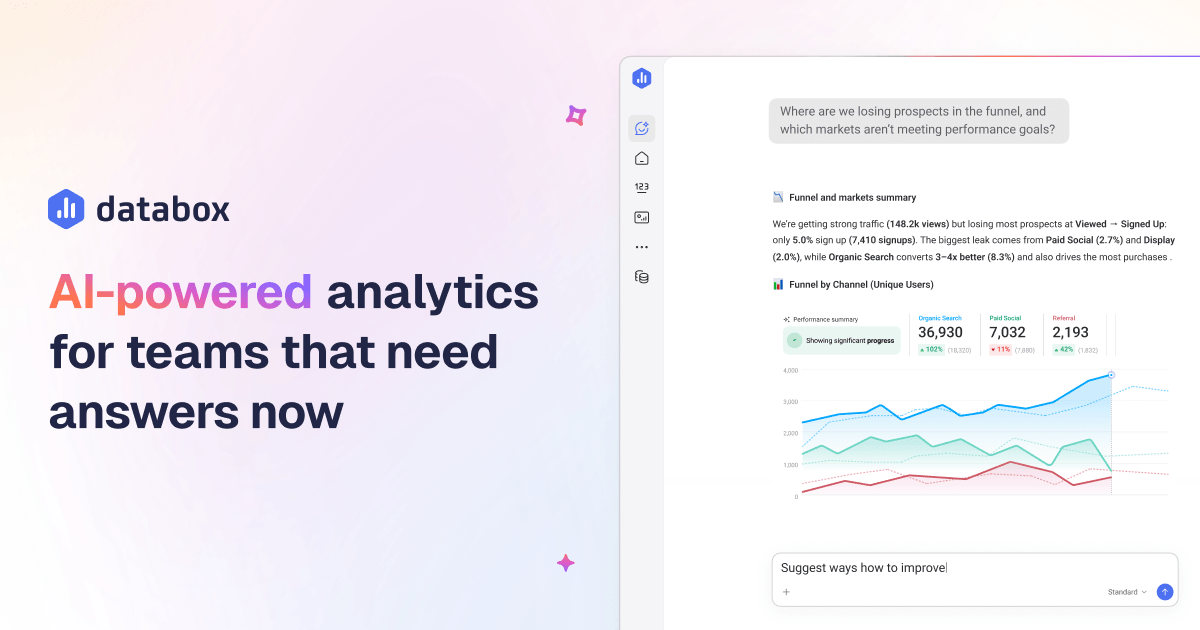
What is Databox?
Key features
Multi-source data integration
connect to popular tools like Google Analytics, Salesforce, HubSpot, Shopify, and dozens of others
Customisable dashboards
build visual reports tailored to your business metrics and KPIs
Automated reporting
schedule reports to be generated and distributed automatically on a set schedule
Data alerts
set notifications when metrics hit certain thresholds or change significantly
Secure sharing
distribute reports to team members and stakeholders with permission controls
Real-time data monitoring
view up-to-date metrics across all connected sources
Pros & cons
Advantages
- Reduces time spent manually gathering and formatting data from multiple sources
- Provides flexibility to build reports specific to your business needs rather than using generic templates
- Freemium model lets you try basic functionality without upfront cost
- Centralises data from many different platforms in one dashboard
Limitations
- Learning curve to set up integrations and design useful dashboards effectively
- Free tier likely has limits on data sources, users, or report frequency that may constrain smaller teams
Use cases
Marketing teams tracking campaign performance across multiple channels and reporting results to leadership
Sales managers monitoring pipeline metrics, conversion rates, and team performance in real-time
E-commerce businesses tracking revenue, customer acquisition costs, and inventory metrics daily
Executives viewing company-wide KPIs and performance trends without requesting manual reports
Data analysts automating routine reporting tasks to focus on deeper analysis
Ready to try Databox?
Pricing
Free
Free
Basic dashboard creation, limited data sources, core integrations, suitable for personal use or small teams getting started
Paid Plans
Pricing varies by usage and features
Unlimited data sources, advanced integrations, more users, enhanced security and support, custom report scheduling
Get started with Databox
Click through to Databox and start using it now.
- Free plan available
- No credit card