
Klipfolio
Real-time data analysis, interactive dashboards, and automated alerts for staying informed on key metrics.
- Freemium
- Web, iOS, Android, API
- Data & AnalyticsAI Product AnalyticsAI Dashboard Builders
- Free plan available
- No credit card
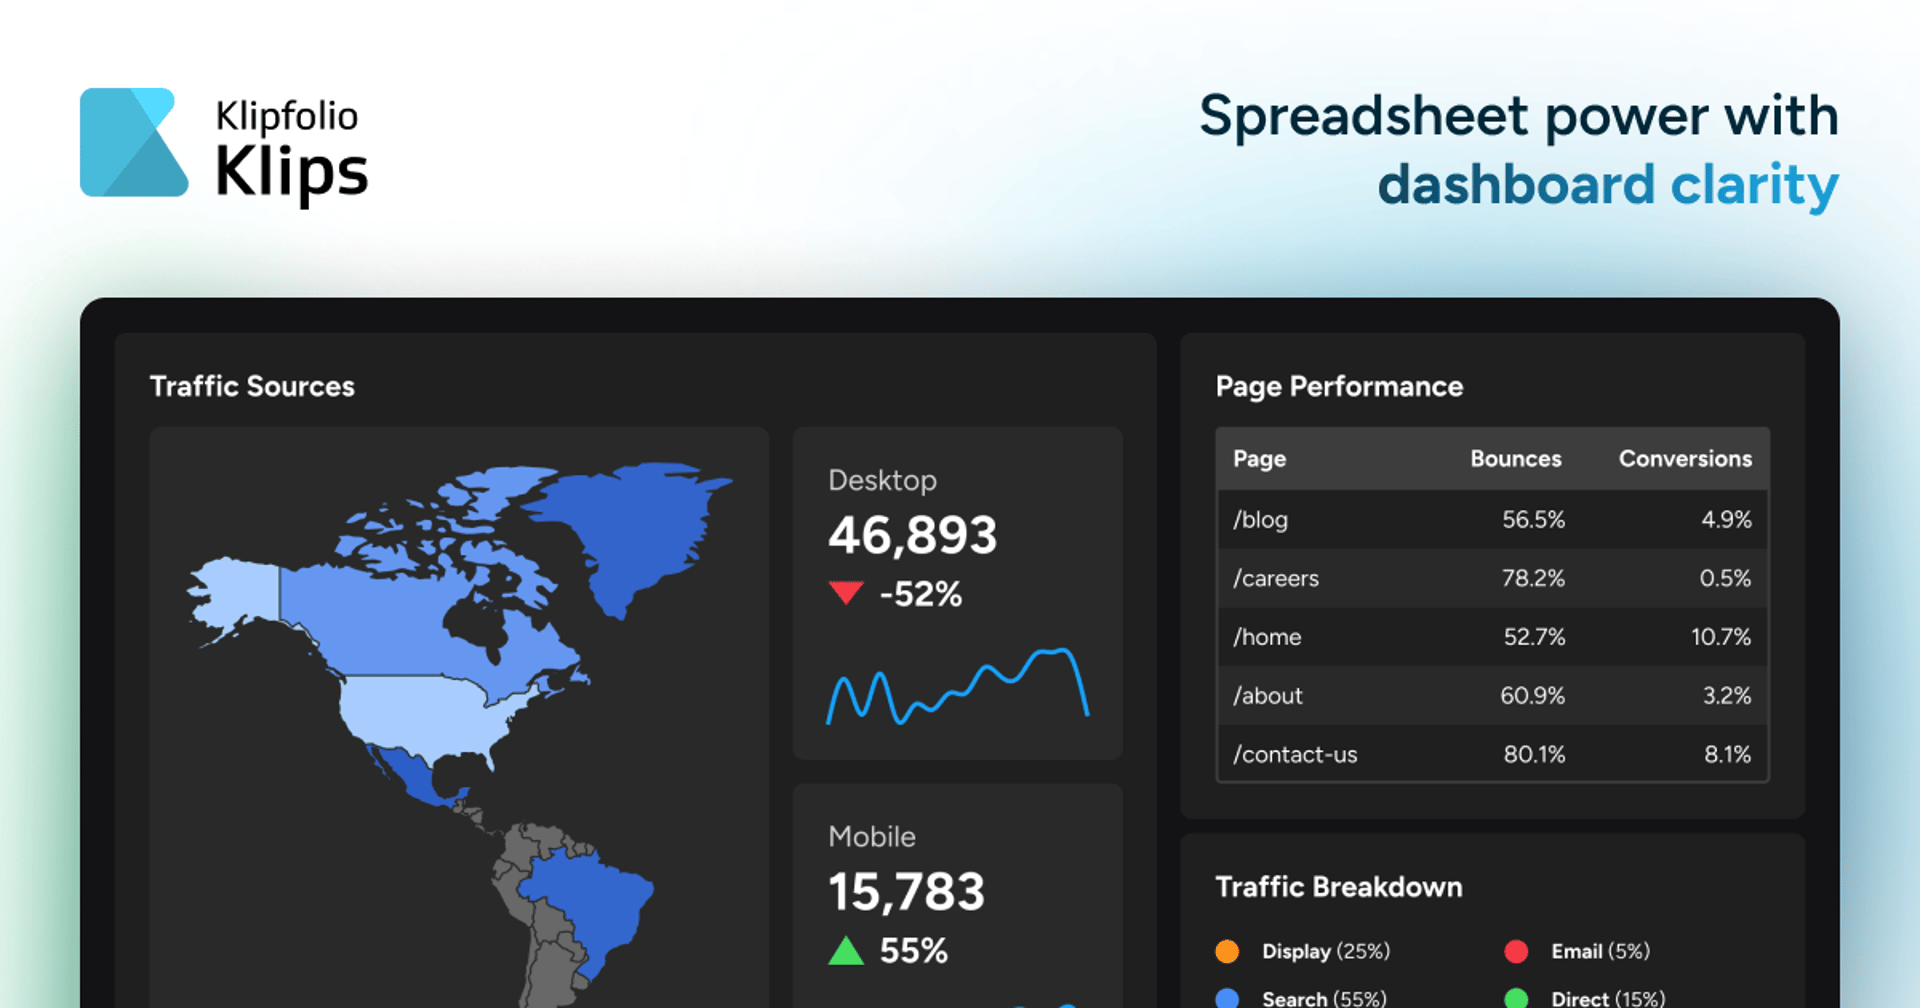
What is Klipfolio?
Key features
Real-time dashboard creation
drag-and-drop interface to build custom views of your data without coding
Multiple data source connectors
integrates with spreadsheets, CRM systems, analytics platforms, databases, and business applications
Automated alerts
set conditions to receive notifications when metrics exceed or fall below specified thresholds
Interactive visualisations
charts, gauges, tables, and other visual formats to represent data clearly
Team collaboration
share dashboards with colleagues and set different permission levels for viewing or editing
Mobile viewing
access dashboards on mobile devices to check metrics on the go
Pros & cons
Advantages
- No technical skills required; most people can build a functional dashboard within minutes using the visual interface
- Covers a broad range of data sources, so you can monitor metrics from multiple tools in one place
- Alerts help teams react quickly to changes rather than relying on scheduled reports or manual checking
- Freemium option lets you trial the tool for basic use cases before paying
Limitations
- Free tier has significant limitations on the number of dashboards, data connections, or team members you can add
- Setup and customisation can become time consuming if you're pulling from many different data sources or building complex dashboards
- Pricing scales up quickly for larger teams or heavy data usage, which may not suit every budget
Use cases
Sales teams tracking pipeline metrics, revenue, and deal progress in one place
Marketing departments monitoring campaign performance, website traffic, and lead generation across channels
Customer support tracking ticket volumes, resolution times, and customer satisfaction scores
Finance teams reviewing budget spending, cash flow, and expense trends
Operations monitoring KPIs like production metrics, delivery times, or system uptime across multiple platforms
Ready to try Klipfolio?
Pricing
Free
Free
Limited dashboards, basic connectors, up to 2 users, suitable for small teams or trial use
Professional
Contact for pricing
Unlimited dashboards, full connector library, team collaboration, alerts, and support
Enterprise
Contact for pricing
Custom integrations, advanced security and governance, dedicated support, and SLA guarantees
Get started with Klipfolio
Click through to Klipfolio and start using it now.
- Free plan available
- No credit card