
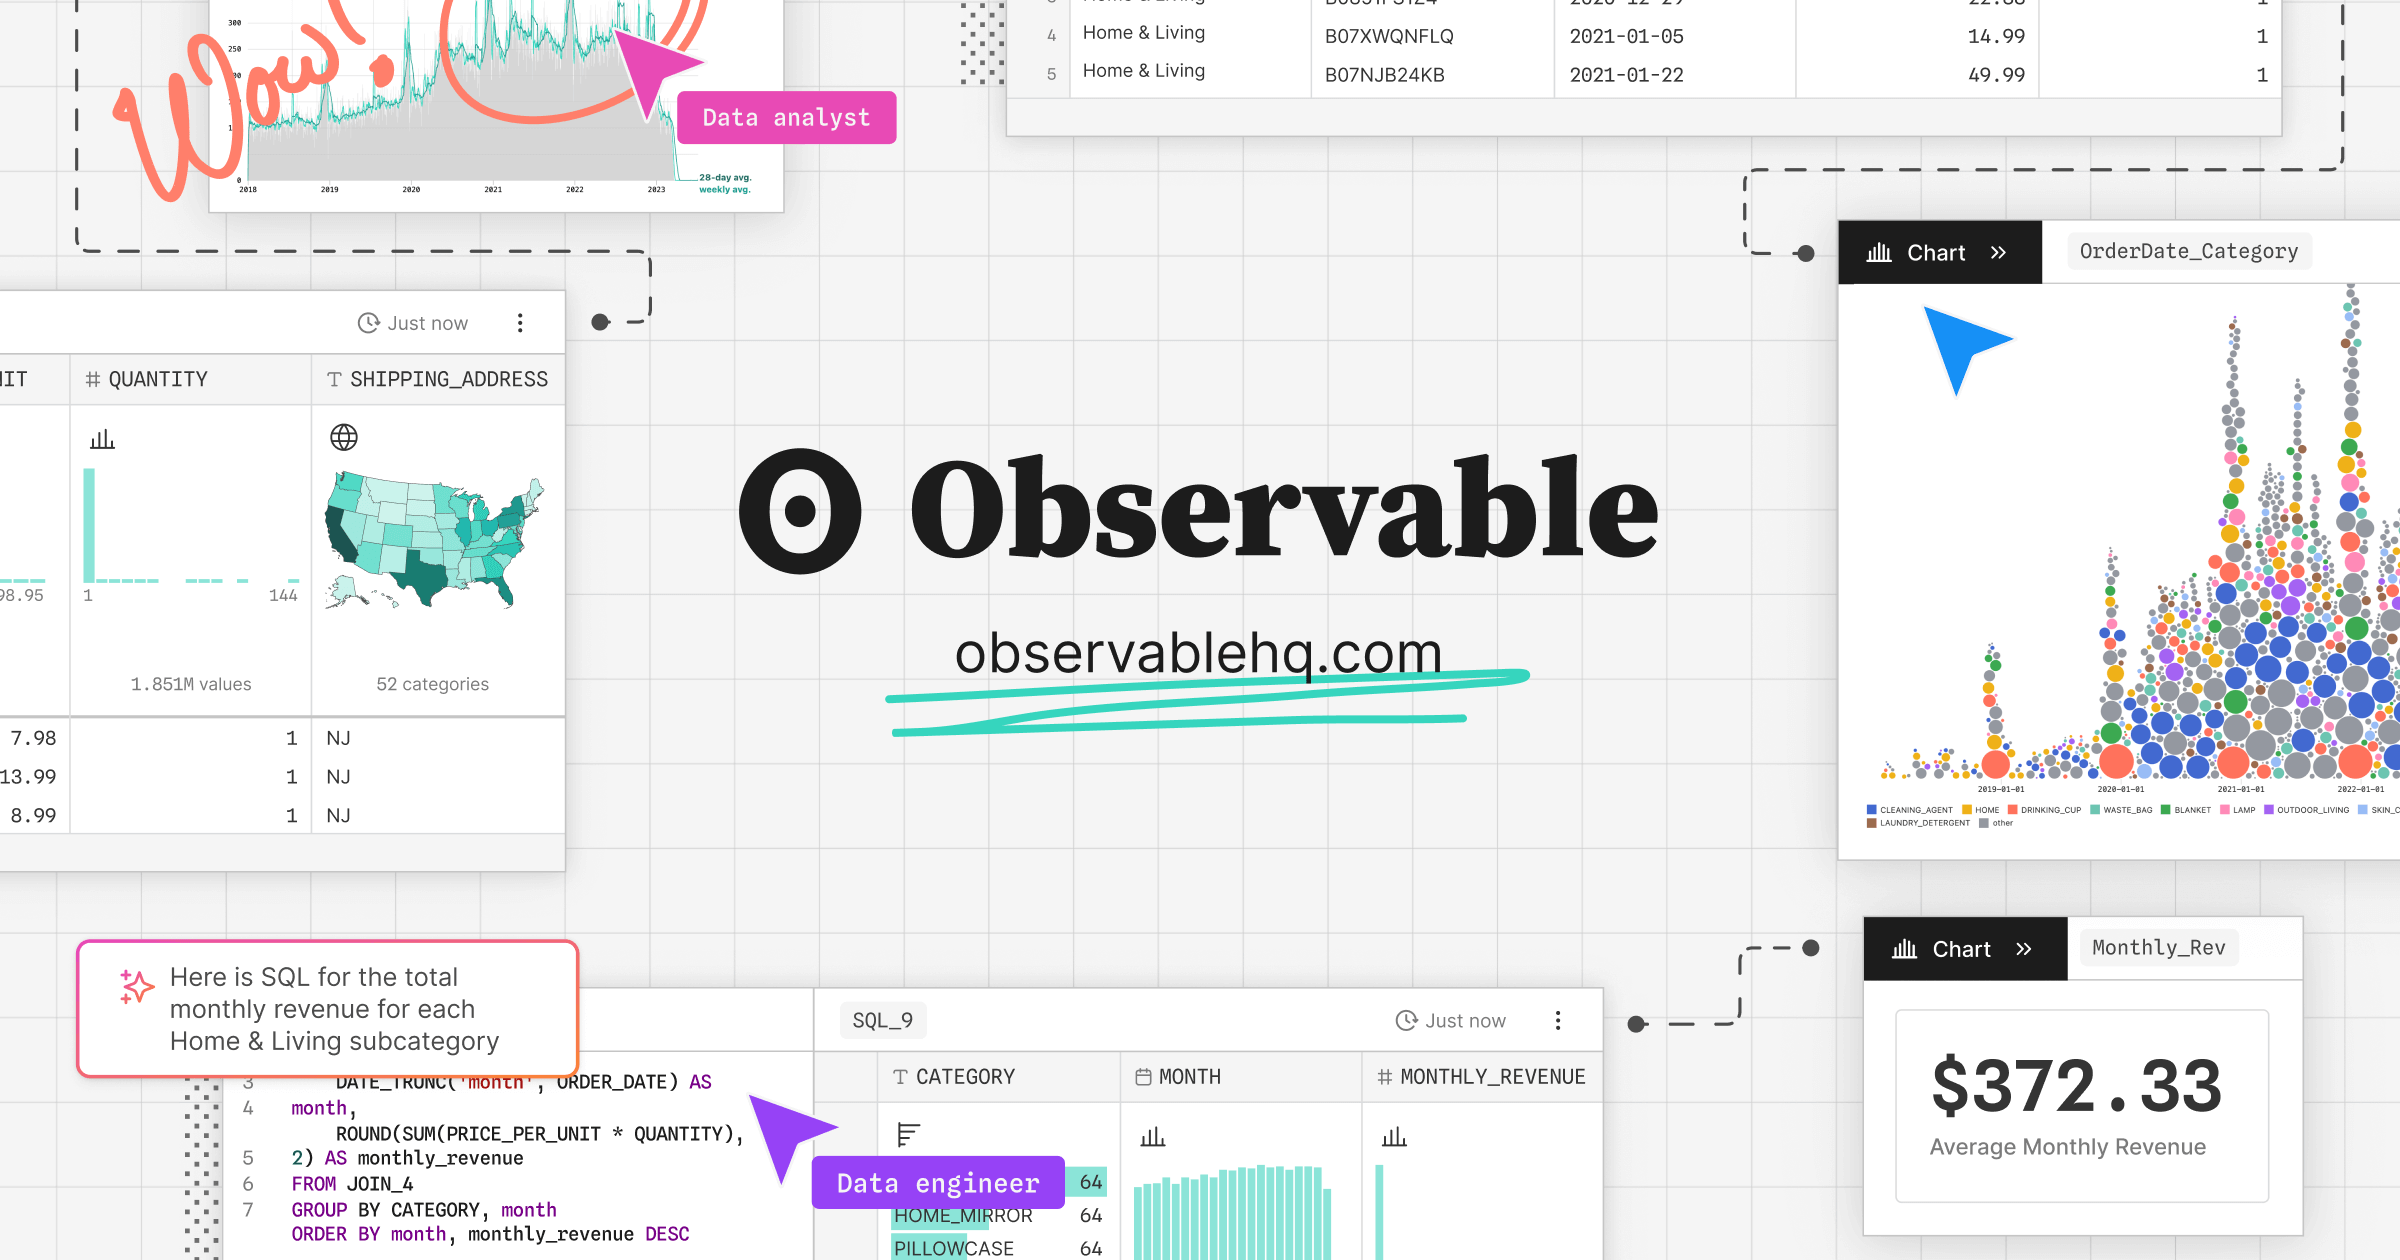
Observable
Observable is a collaborative data visualization platform built around JavaScript notebooks that enables data teams to create, share, and reuse interactive char Pricing: Freemium (Free for public note
- Freemium
- Web
- Data & AnalyticsWritingImage Generation
- Free plan available
- No credit card
What is Observable?
Key features
JavaScript notebooks
Write and execute code in an interactive, cell-based environment with immediate visual feedback
Built-in visualisation libraries
Access to common charting and graphing tools without external dependencies
Collaboration and sharing
Publish notebooks publicly or share privately with team members; others can view, fork, and iterate on your work
Reactive computation
Code cells automatically update when dependencies change, similar to spreadsheet formulas
Reusable components
Create and import custom functions and visualisations across projects
Version control and history
Track changes to notebooks over time
Pros & cons
Advantages
- Lower barrier to entry than building visualisations from scratch with raw JavaScript; particularly useful for analysts without deep web development experience
- Strong community and marketplace of shared notebooks and modules; many common data visualisation patterns are already available
- Good for exploratory data analysis and rapid prototyping; you can move from idea to interactive chart quickly
- Public notebooks serve as both documentation and working tools, making them valuable for sharing findings or teaching concepts
Limitations
- Learning curve for those unfamiliar with JavaScript or notebook-style coding; less intuitive than drag-and-drop tools like Tableau
- Free tier limited to public notebooks; privacy or proprietary work requires a paid subscription
- Performance can degrade with large datasets or complex visualisations; primarily designed for interactive exploration rather than handling massive-scale data
Use cases
Exploratory data analysis and prototyping visualisations before deploying them elsewhere
Publishing interactive reports and findings that stakeholders can explore directly in the browser
Building reusable data visualisation components and sharing them across a team or organisation
Teaching data visualisation or data science concepts with live, interactive examples
Creating internal dashboards or monitoring tools without the overhead of a dedicated business intelligence platform
Ready to try Observable?
Pricing
Get started with Observable
Click through to Observable and start using it now.
- Free plan available
- No credit card